Editorial · Data Visualization
Turning Numbers Into Narrative.
Editorial information design translating medical-device industry data into a compact visual narrative.
ROLE
Production · Information Design
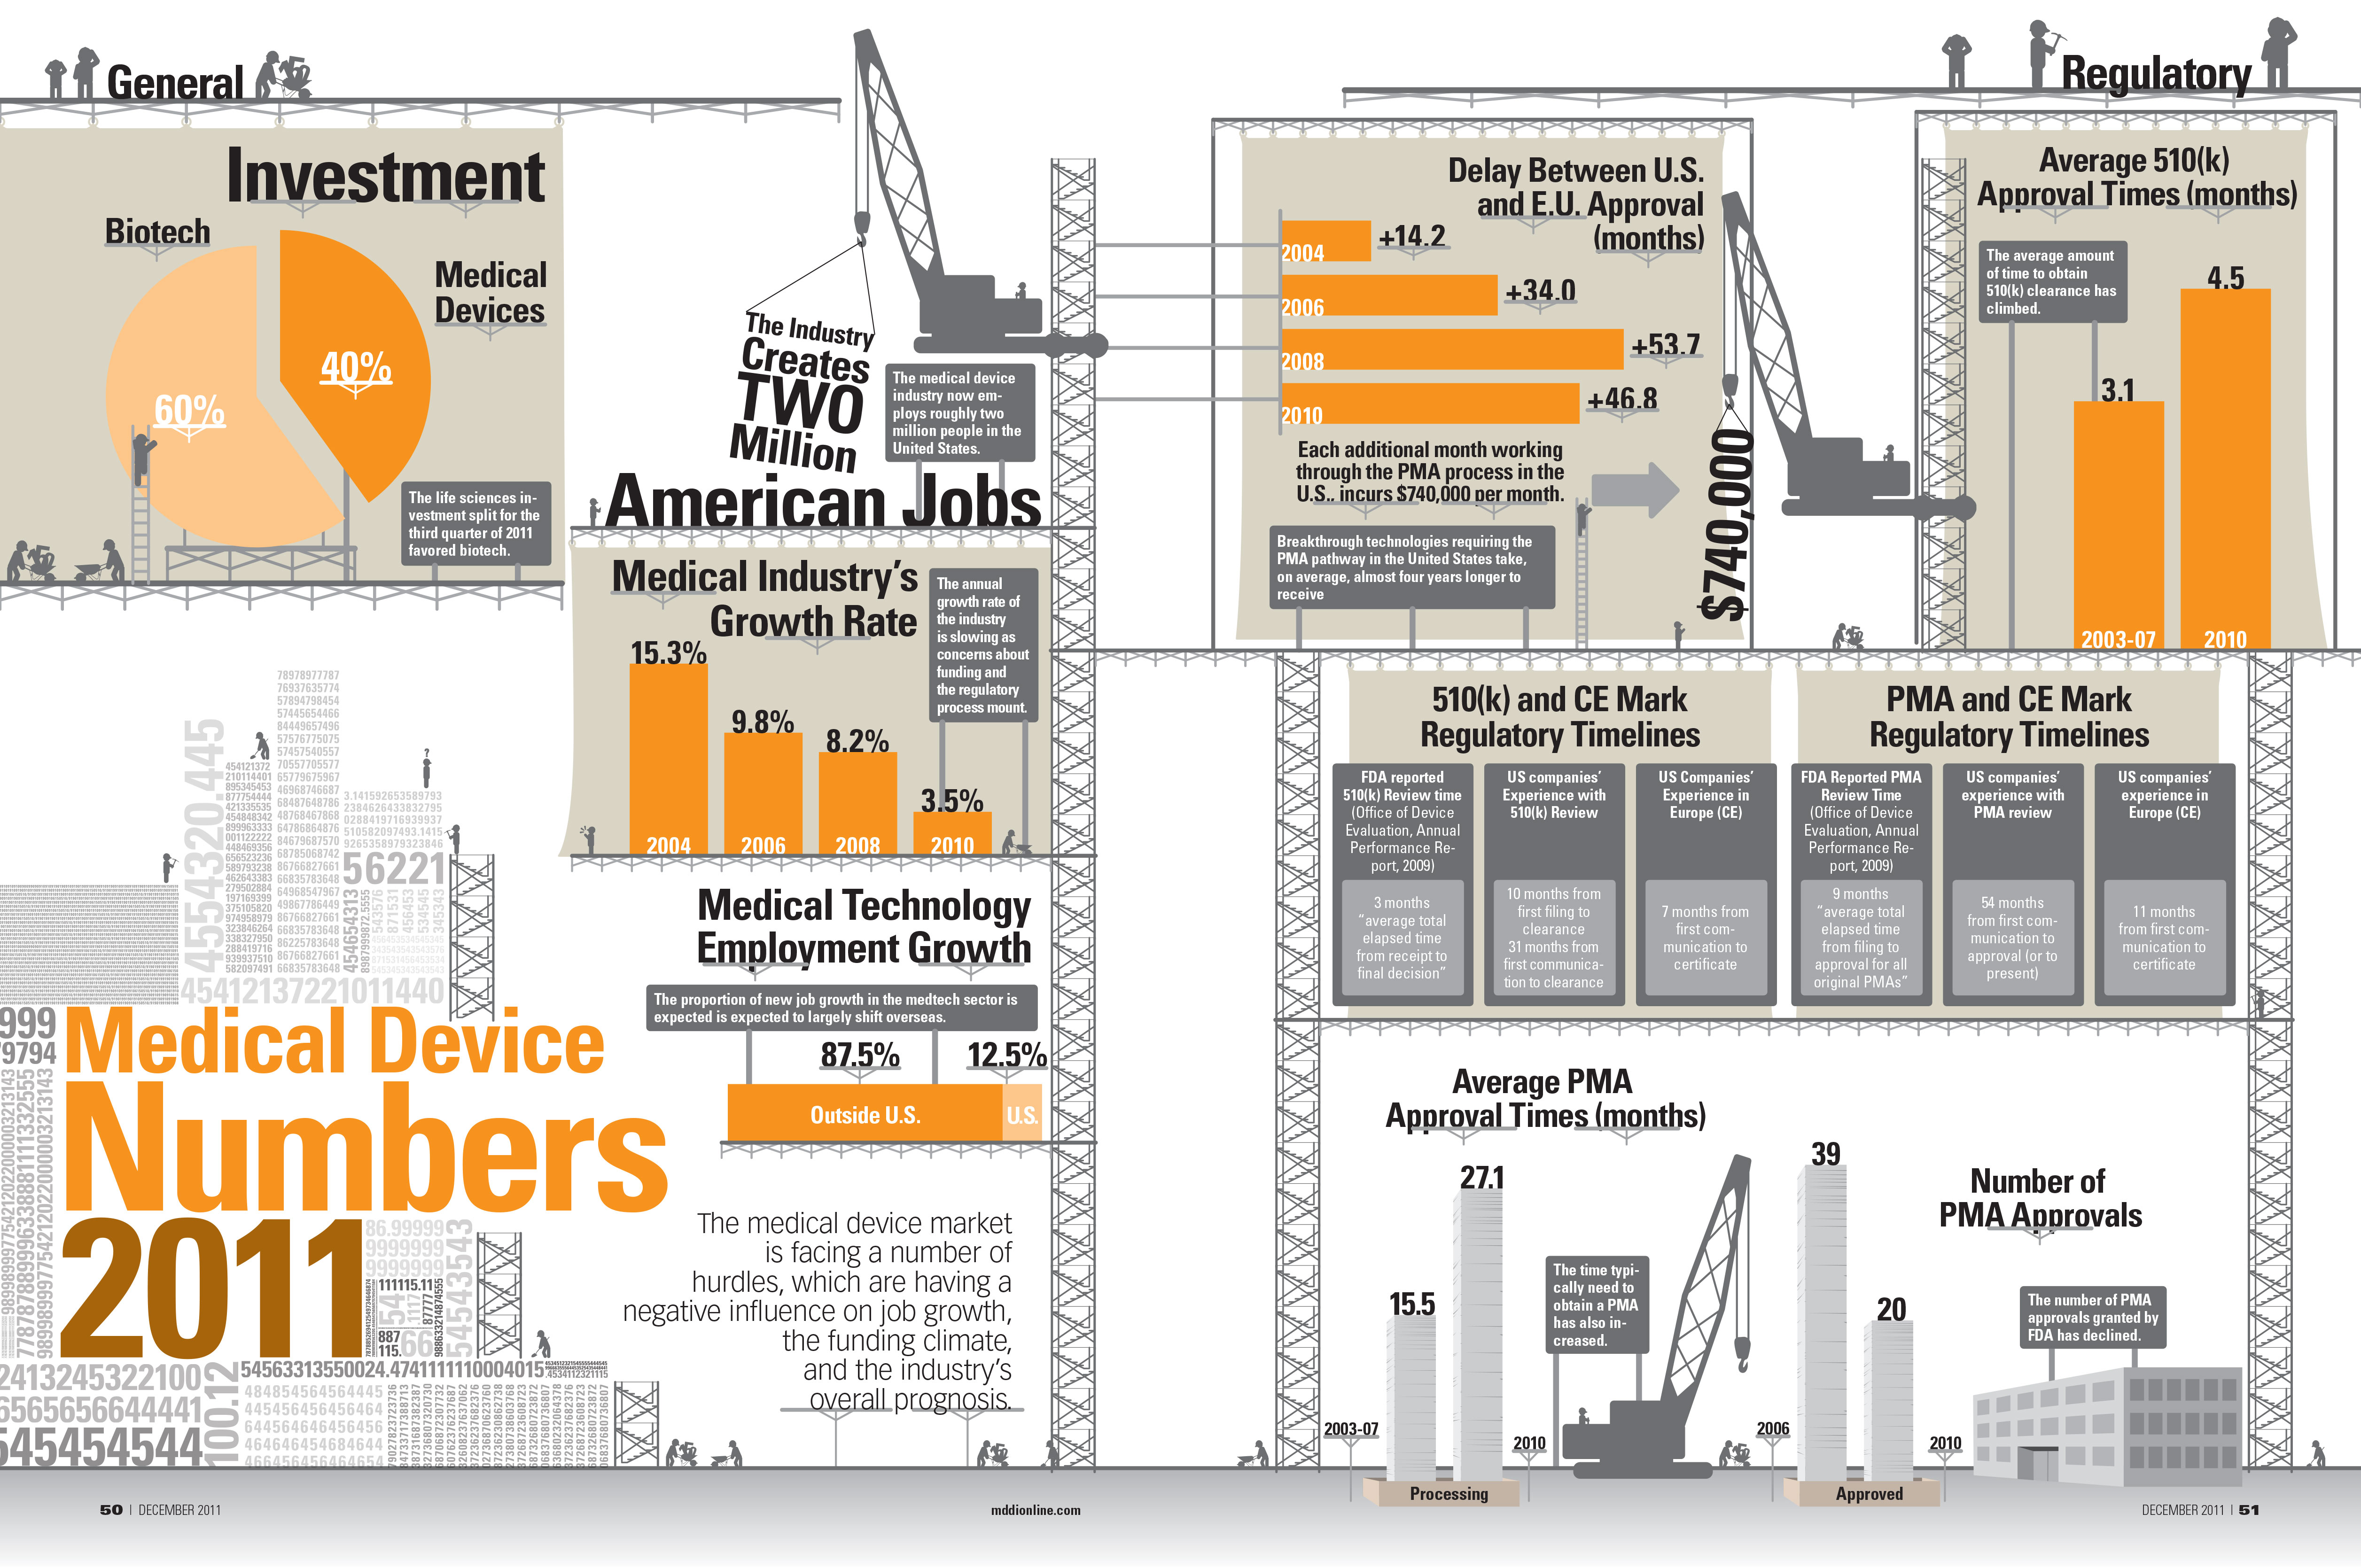
THE STORY
Earlier in my career, editorial production taught me how much information a page can hold before it stops communicating.
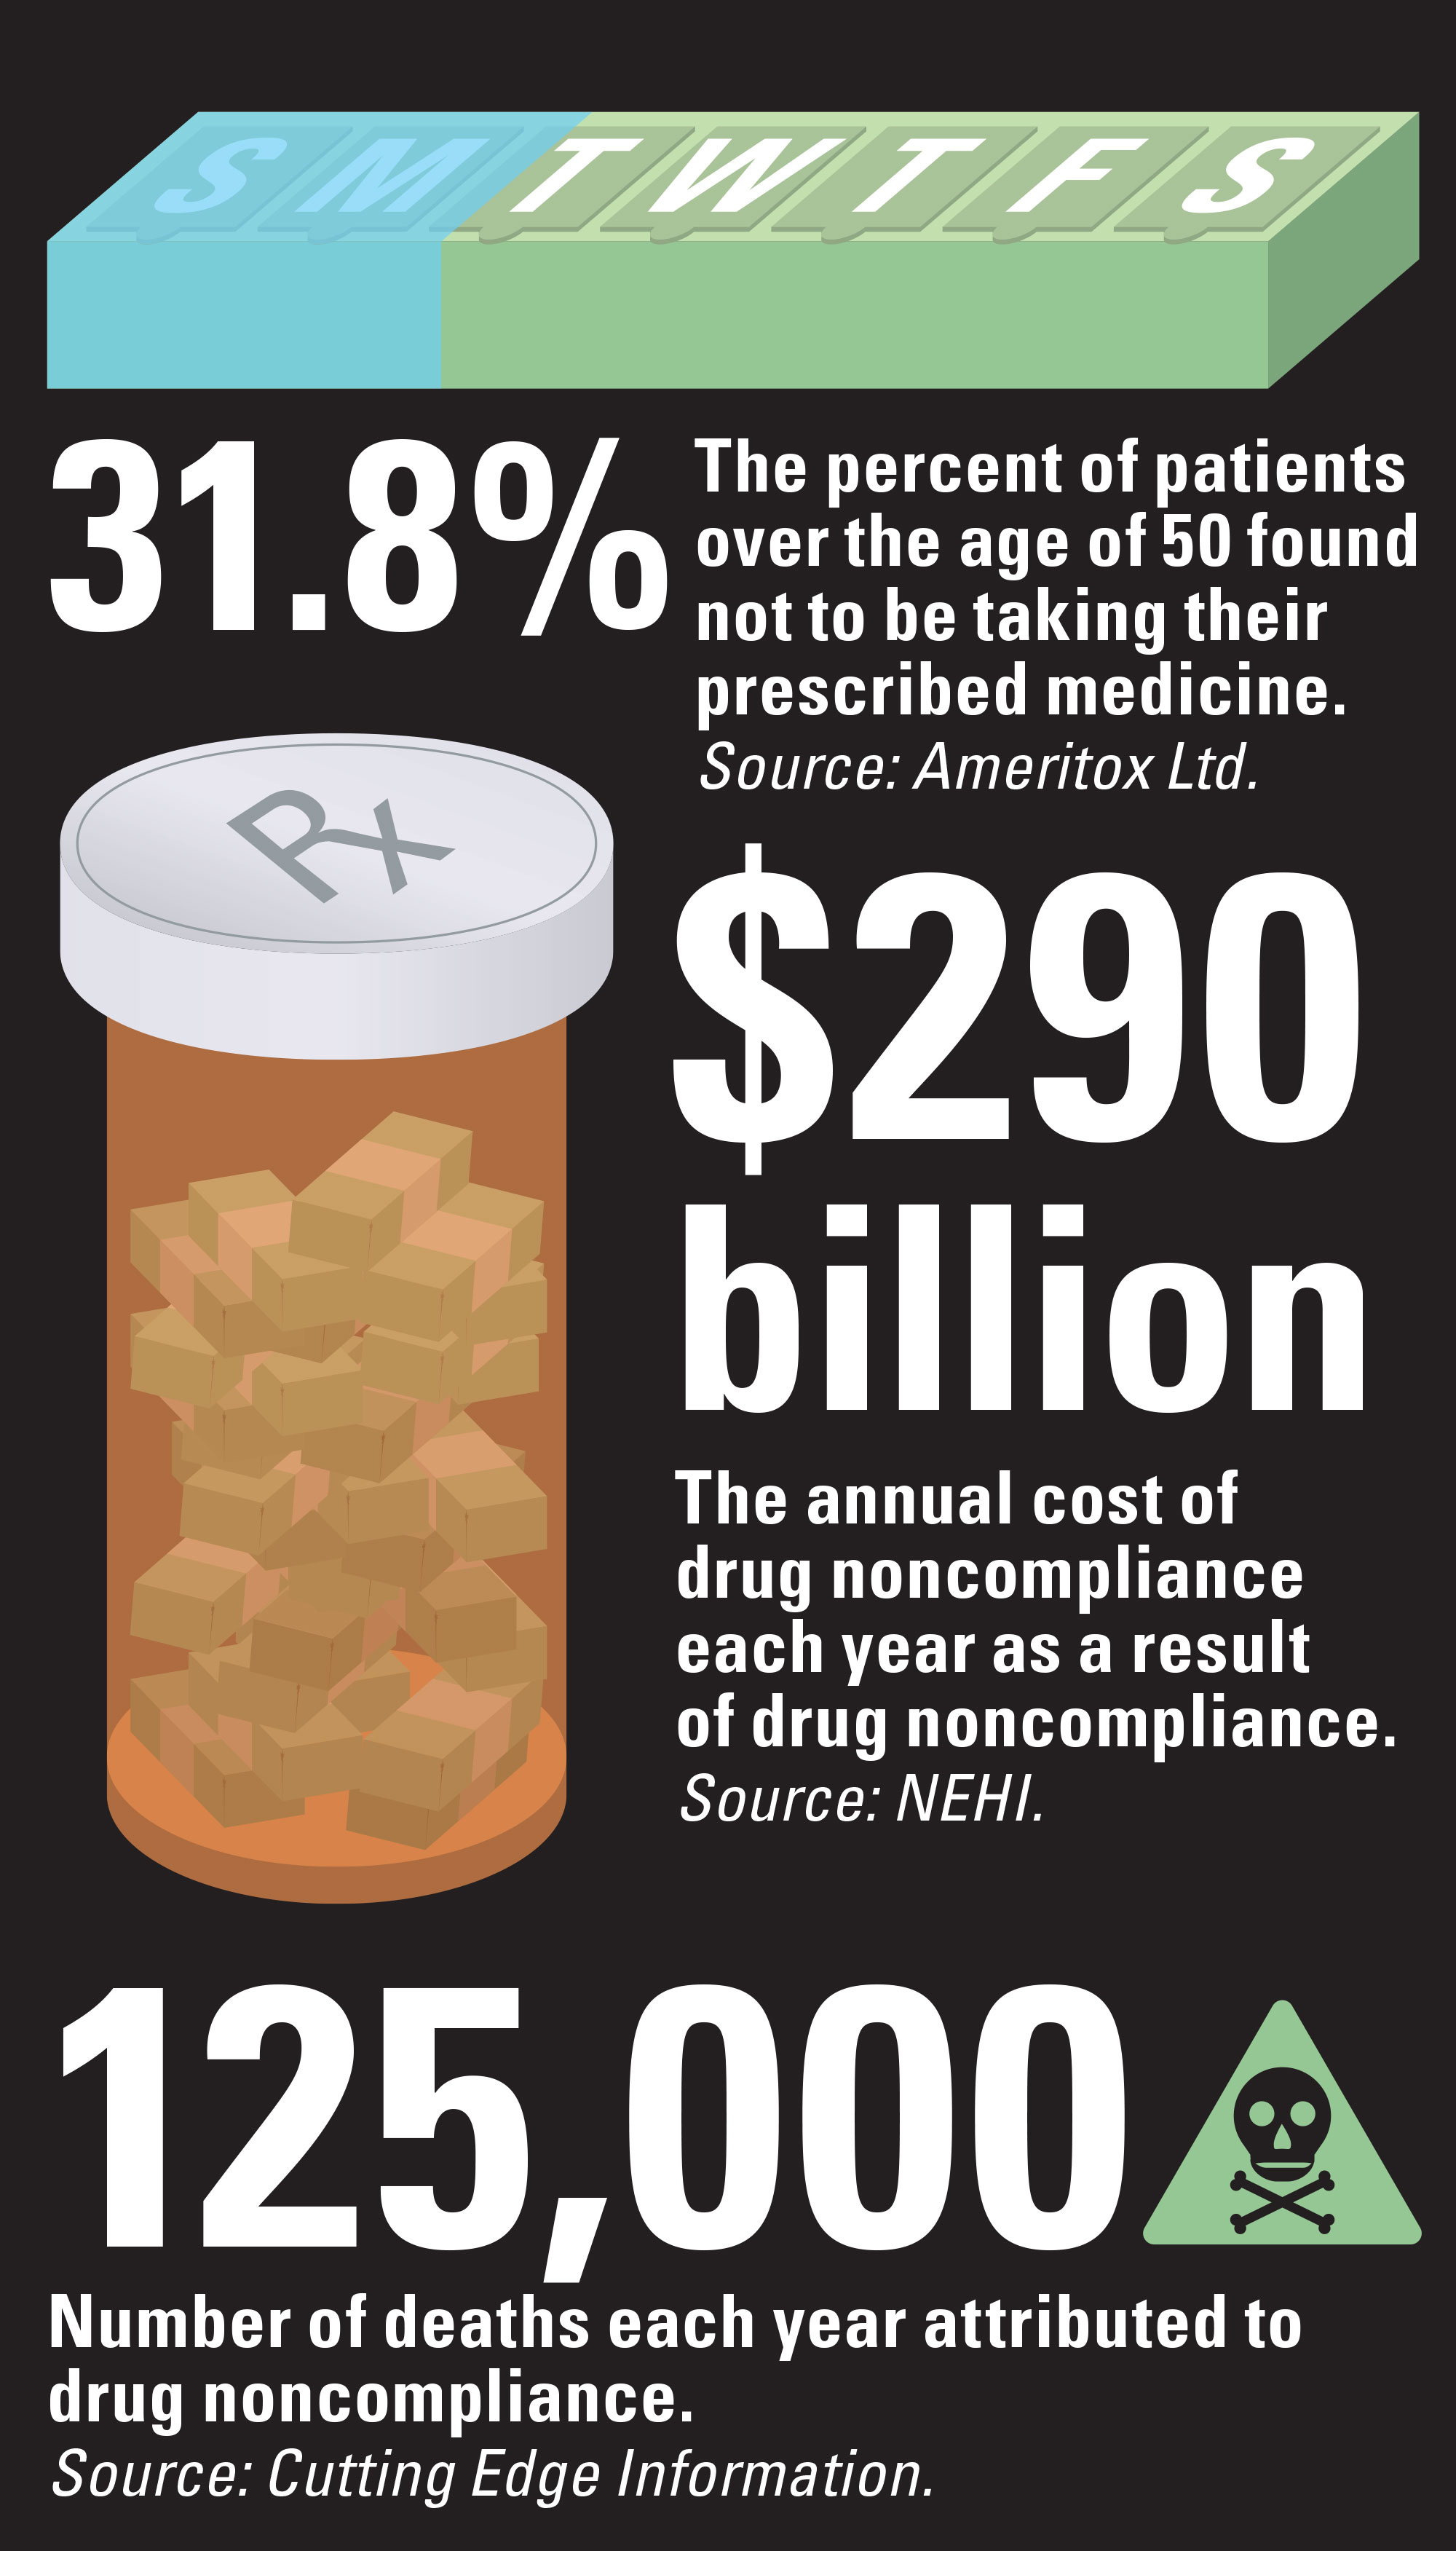
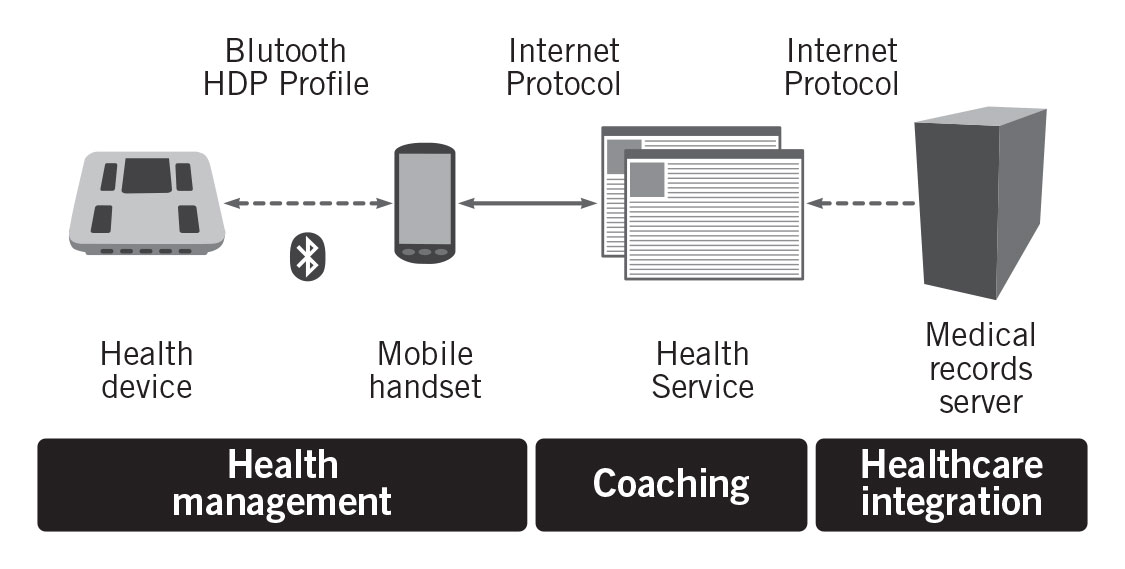
For Medical Device & Diagnostic Industry, I worked across a demanding monthly publishing environment and created technical figures, charts, tables and data-driven layouts. The Numbers project translated regulatory timelines, employment, investment and industry data into a compact visual story.
It remains useful evidence of the foundation underneath everything that followed: hierarchy, typography, pacing and the ability to make dense information feel intentional.
SELECTED EVIDENCE
The Work Behind the Story.